NEET-XII-Physics
neet 2020 questions with solutions year:2020
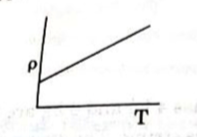
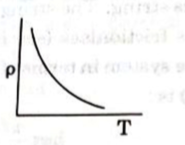
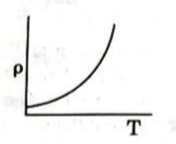
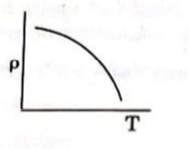
- #28Which of the following graph represents the variation of resistivity `` (\rho) `` with temperature (T) for copper ?
(A)
(B)
(C)
(D)
digAnsr: CAns : For some metals like copper, resistivity is nearly proportional to temperature although a non linear region always exists at very low temperature