back
refresh
Sign up
Home
Learn Fast
select Course
Show Unit/Chapter
Change Unit
Change Subject
Last Menu
NEET-XII-Physics
qstns with ansrs year:2022
Previous Unit
Next Unit
with Solutions - page 2
Qstn# 35
Prvs-Qstn
Next-Qstn
#35
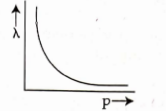
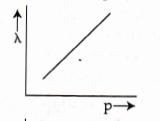
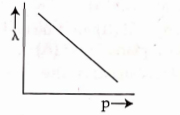
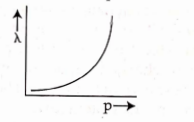
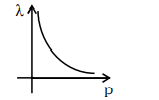
The graph which shows the variation of the de Broglie wavelength `` (\lambda) `` of a particle and its associated momentum ( `` p ) `` is :
(A)
(B)
(C)
(D)
Hide Answer
digAnsr:
A
Ans
:
`` \lambda=\frac{ h }{ p } ``
Graph will be hyperbolic
+