back
refresh
Sign up
Home
Learn Fast
select Course
Show Unit/Chapter
Change Unit
Change Subject
Last Menu
NEET-XII-Chemistry
Previous Year Paper year:2021
Previous Unit
with Solutions - page 2
Qstn# A-25
Prvs-Qstn
Next-Qstn
#25
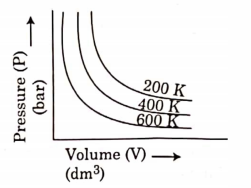
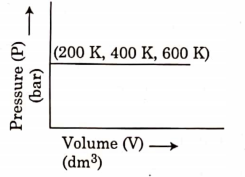
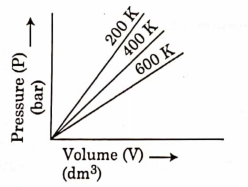
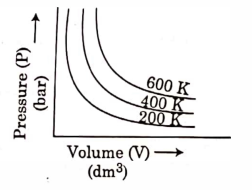
Choose the correct option for graphical representation of Boyle’s law, which shows a graph of pressure vs. volume of a gas at different temperatures:
(A)
(B)
(C)
(D)
Hide Answer
digAnsr:
C
Ans
:
C
+