ICSE-X-Mathematics
Previous Year Paper year:2009
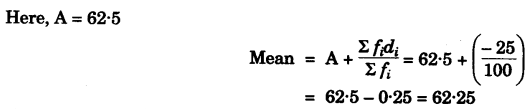
- #6-c [4]The following table gives the wages of workers in a factory:
Calculate the mean by the short cut method.Wages in Rs. 45-50 50-55 55-60 60-65 65-70 70-75 75-80 No. of workers 5 8 30 25 14 12 6 Ans :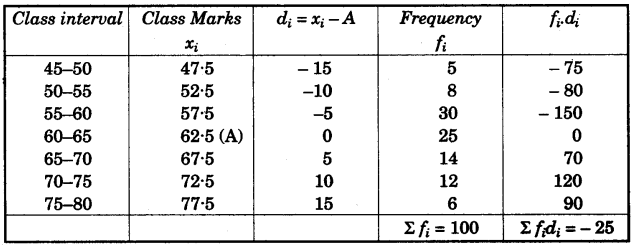
- #7
- #7-aAmit Kumar invests Rs. 36,000 in buying Rs. 100 shares at Rs. 20 premium. The dividend is 15% per annum. Find:Ans :

- #7-a-iThe number of shares he buys
- #7-a-iiHis yearly dividend
- #7-a-iii [3]The percentage return on his investment. Give your answer correct to the nearest whole number.
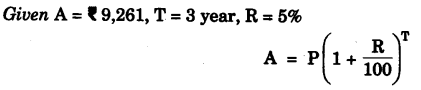
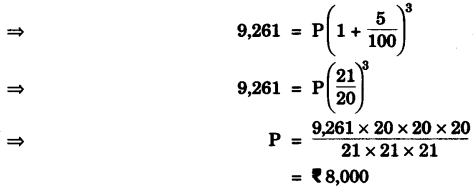
- #7-b [3]What sum of money will amount to Rs. 9,261 in 3 years at 5% per annum compound interest?Ans :
- #7-c [4]Mr. Mishra has a Savings Bank Account in Allahabad Bank. His pass book entries are as follows:
Rate of interest paid by the bank is 4.5% per annum. Mr. Mishra closes his account on 30th October, 2007. Find the interest he receives.Date Particulars Withdrawals (in Rs.) Deposits (in Rs.) Balance (in Rs.) Jan. 4, 2007 By Cash - 1000.00 1000.00 Jan. 11, 2007 By Cheque - 3000.00 4000.00 Feb. 3, 2007 By Cash - 2500.00 6500.00 Feb. 7, 2007 To Cheque 2000.00 - 4500.00 March 3, 2007 By Cash - 5000.00 9500.00 March 25, 2007 By Cash - 2000.00 11,500.00 June 7, 2007 By Cash - 3500.00 15000.00 Aug. 29, 2007 To Cheque 1000.00 - 14000.00 Ans :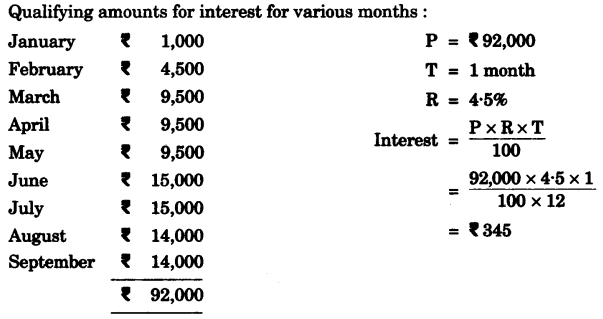
- #8-cThe given figure represents a hemisphere surmounted by a conical block of wood. The diameter of their bases is 6 cm each and the slant height of the cone is 5 cm. Calculate:Ans :
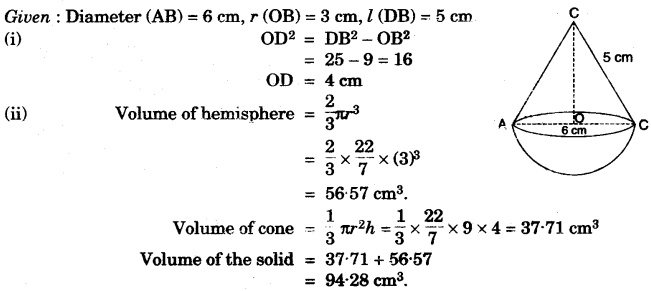
- #8-c-ithe height of the cone.
- #8-c-ii [4]the volume of the solid.

- #9
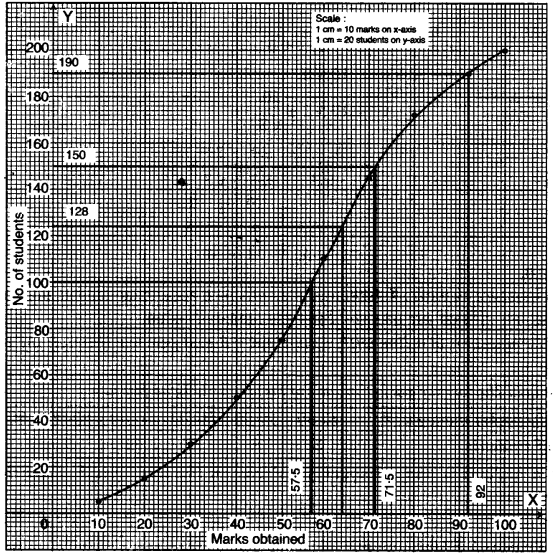
- #9-aAttempt this question on graph paper.
Marks obtained by 200 students in examination are given below:
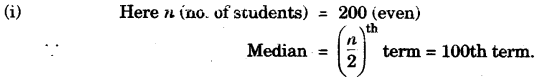
Draw an Ogive for the given distribution taking 2 cm = 10 marks on one axis and 2 cm = 20 students on the other axis. From the graph find:Marks 0-10 10-20 20-30 30-40 40-50 50-60 60-70 70-80 80-90 90-100 No. of Students 5 10 14 21 25 34 36 27 16 12 Ans :Marks No. of students cf 0-10 5 5 10-20 10 15 20-30 14 29 30-40 21 50 40-50 25 75 50-60 34 109 60-70 36 145 70-80 27 172 80-90 16 188 90-100 12 200