ICSE-X-Geography
01: Map Study: Interpretation of Topographical Maps Class 10 Geography
Note: Please signup/signin free to get personalized experience.
Note: Please signup/signin free to get personalized experience.
10 minutes can boost your percentage by 10%
Note: Please signup/signin free to get personalized experience.
- Qstn #5Convert the following R.F., into scales.
Ans :
If R.F., is 1 : 2,500,000 what is the scale (pAns: in centimetre and kilometre).
R.F. = (Distance on the map)/(Distance of the ground)
= 1 cm/2,500,000
= 1 cm/1 km
- Qstn #6What do you mean by ‘Marginal Information’?
Ans :
Marginal Information can be obtained from the margin of the sheet. The name of the state to which the area belongs is given at the top of the sheet. The year when the area was surveyed is also mentioned. The number of the sheet is given in the right hand top comer. The direction of the magnetic variation and true north position is also given in the right hand top corner.
- Qstn #7Why are directions on a map important?
Ans :
Since mapping is primarily a science of whereabouts a student of geography should, therefore, be familiar with directions and also the methods of finding out directions on different occasions and in various circumstances.
- Qstn #8Mention the methods by which directions are located.
Ans :
Some methods by which directions can be located are:
- Angular Bearing
- By Magnetic Compass
- The Pole Star
- Sunrise and Sunset.
- Qstn #9How the compass direction of an object, feature or place given from the given point?
Ans :
- Direction: The upper part of a map is North, your right hand is East and left hand West. The down part is South. You must be careful from which town or feature to give direction.
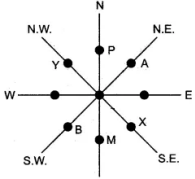 From B — A is in N. E. Direction From A — B is in S. W. Direction From Y — X is in S. E. Direction From P — M is in South Direction From M — P is in North Direction From X — Y is in N. W. Direction
 - Bearing: Direction can be indicated by a system of angular bearing. Bearing is the horizontal angle between the North and line joining the position- of the observer and the object in a clockwise direction. The bearing from the observer to the object is called forward bearing (FB). The bearing from the object to the observer is called backward bearing (BB).

- Direction: The upper part of a map is North, your right hand is East and left hand West. The down part is South. You must be careful from which town or feature to give direction.
- Qstn #10Calculate the average gradient along the two stations A and B, if the horizontal distance between them is 1,200 metres and the vertical difference in height is 240 metres.
Ans :
(Vertical Interval)/(Horizontal equivalent) = 240/1,200
= 1/5 or 1 : 5
- Qstn #11What is a Watershed?
Ans :
A watershed or water divide is a ridge which separates the tributaries draining towards one side of it from those drawing towards the other. A watershed is never half way up a slope and on the two sides of it, the slope must be opposite and downwards.
- Qstn #12What are ‘Eastings’ and ‘Northings’?
Ans :
The position of a certain feature on the sheets is indicated eastward and southward. The eastward lines of the grid are known as Northings. The northward lines of the grid are known as Eastings. These have been named Eastings and Northings because they indicate distances eastward and northward respectively from the point of origin.
- Qstn #13The area is measured by grid square method?
Ans :
To find the area by the grid square method: The grid square on toposheet measures 2 cm × 2 cm., or 1 km., × 1 km., since 2 cm., is equal to 1 km. Therefore, the area of each square is 1 sq. km. To find particular area on a topographical map:
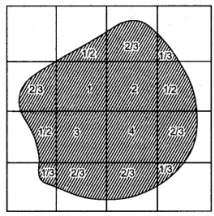 No. of complete squares : 4 = 3.0 sq. km.
-1.
No. of 1/2 squares : 2 = 1.0 sq. km.
No. of 2/3 squares : 5 = 3.3 sq. km.
-2.
No. of 1/3 squares : 4 = 1.3 sq. km
= 9.6 sq. km
Note the number of complete grid square within the area and the number of squares lying within the area are not complete.
- Square covered half are taken as 1 /2 squares.
- Square covered more than half are taken as 2/3 squares.
- Square covered less than half are taken as 1/3 squares.
Add all the squares thus, the area which has to be found out is calculated. Question
- Qstn #14Which colours are used on toposheets? What is their significance?
Ans :
Six colours are used in a survey map to show various features. They are as follows:
- Black: All names, river banks, broken grounds, dry streams, surveyed trees, heights and their numbering, railway tracks, telephone and telegraph lines.
- Yellow: All cultivated areas.
- Green: All wooded/forested areas, scattered trees and scrubs.
- Brown: Contour lines, their numbering, stony waste, sand features.
- Blue: All water bodies, where they contain water.
- Red: Grid lines and their numbering, roads, cart tracks, settlements, huts and other buildings.
- Qstn #15What is a Nodal centre?
Ans :
A town, which is at the junction of many routes is usually very important and is having dense settlements, reflect the availability of industry and commerce. The availability of minerals can also cause the growth big towns.
- #Section : CLong Questions
- Qstn #1In what ways is the scale represented on a map?
Ans :
Representation of Map Scale: Map scales are represented in the three forms:
- A Statement: This is the easiest method of describing a map scale. It is usually written on maps as 1 cm, to 10 km.
- A Ratio: In this method the map scale is expressed as a numeric ratio. The numerator represents the map distance and it is always expressed as a unit. The denominator represents the corresponding ground distance, i.e., one unit on the map is equivalent to a number of units on the ground. It is also known as ratio-scale or Representative Fraction (R.F.) Representative Fraction (R.F.) = (Distance on the map)/(Distance of the ground)
- A Graph: In this method, scale is represented by means of a linear (line) graph. It consists of a straight line divided into a number of equal parts (primary and secondary) which are marked to show what these divisions represents on the actual ground.
- Qstn #2The distance is measured on the topographic map. There are two methods of measuring distance on the toposheets,
i. Direct-method,
ii. Indirect method.
Measuring straight distance is a direct method and measuring through a winding course is an indirect method. Explain both the methods.
Ans :
i. To measure the straight distance: To measure the shortest distance between two points on the topographic map along a straight line can be done easily with the help of a pair of divider. Keep the two pointed ends of the divider over line or two points which has to be measured and then carefully keep on scale. Note down the distance on the map in centimetres; then either with the help of the graphical scale which is provided below the toposheet or by using the statement scale distance can be measured in kilometres and metres.
e.g., two places are 5.6 km., apart on the map.
The scale is given 2 cm. = 1 km.
⇒ 1 cm. = 1/2 km.
⇒ 5.6 cm. = 1/2 × 5.6
= 2.8 km.
ii. To measure winding course: To measure a winding course route is complicated. It has to be measured with the help of a strip of paper or thread e.g., to measure a river in a toposheet take a piece of thread make a knot on one end. At the end of thread (close to knot) mark the point with pen at which you will begin to measure (point A). Put the thread along the line touching as far as possible to measure and keep on marking with ink at turns till the last point. Stretch the thread on the scale line, you will get the ground distance in kilometres and metres, writing the unit of measurement is always important e.g., if the distance calculated between two points is 3.3 km. If asked in kilometres the pAns: would be 3km., 300m. If asked in metres the pAns: would be 3300 metres.
- Qstn #3What is Concave Slope and Convex Slope? Explain?
Ans :
Concave Slope: The slope is very gentle at the foot and it goes on getting steeper and steeper towards the top. The spacing between successive contours at the lower level is more than at the higher level.
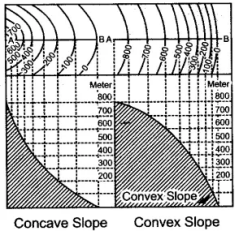 Convex Slope: The slope is very steep at the foot and it goes on becoming gentle towards the top. The contour lines are therefore, unequally spaced but there is a sequence, which is just the opposite of a concave slope diagram. The spacing between successive contours at the lower level is less than at the higher level.