back
refresh
Sign up
Home
Learn Fast
select Course
Show Unit/Chapter
Change Unit
Change Subject
Last Menu
NEET-XII-Physics
Previous Year Paper year:2020
Next Unit
divided into subjects - page 2
Qstn# 163
Prvs-Qstn
Next-Qstn
#163
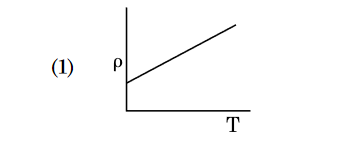
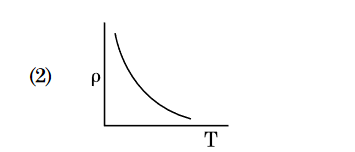
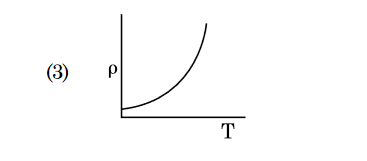
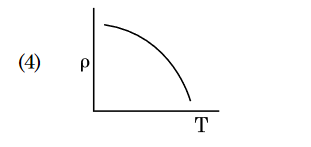
Which of the following graph represents the
variation of resistivity (ρ) with temperature (T) for
copper ?
(1)
(2)
(3)
(4)
Hide Answer
digAnsr:
3
Ans
:
3
+