ICSE-VIII-Mathematics
22: Data Handling Class 8 Maths
Note: Please signup/signin free to get personalized experience.
Note: Please signup/signin free to get personalized experience.
10 minutes can boost your percentage by 10%
Note: Please signup/signin free to get personalized experience.
- #6-iiUpper class limit of 24-30 is ........Ans : Upper class limit of 24 - 30 is 30.
- #6-iiiUpper limit of 5-12.5 is .........Ans : Upper limit of 5 - 12.5 is 12.5
- #6-ivIf the upper and the lower limits of a class interval are 16 and 10; the class-interval is ........Ans : If the upper and lower limits of a class interval are 16 and 10; the class interval is 10 - 16
- #6-vIf the lower and the upper limits of a class interval are 7.5 and 12.5; the class interval is ........Ans : If the lower and upper limits of a class interval are 7.5 and 12.5; the class interval is 7.5 - 12.5
- #Section : B
- Qstn #1Hundred students from a certain locality use different modes of travelling to school as given below. Draw a bar graph.
 Ans :
Ans :
- Qstn #2Mr. Mirza’s monthly income is Rs. 7,200. He spends Rs. 1,800 on rent, Rs. 2,700 on food, Rs. 900 on education of his children ; Rs. 1,200 on Other things and saves the rest.
Draw a pie-chart to represent it.Ans :

- Qstn #3The percentage of marks obtained, in different subjects by Ashok Sharma (in an examination) are given below. Draw a bar graph to represent it.
 Ans :
Ans :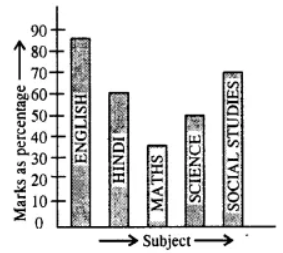
- Qstn #4The following table shows the market position of different brand of tea-leaves.
 Draw it-pie-chart to represent the above information.Ans :

- Qstn #5Students of a small school use different modes of travel to school as shown below:
 Draw a suitable bar graph.Ans :


- Qstn #7Manoj appeared for ICSE examination 2018 and secured percentage of marks as shown in the following table:
 Represent the above data by drawing a suitable bar graph.Ans :
- Qstn #8For the data given above in question number 7, draw a suitable pie-graph.Ans : ∵ 60 + 45 + 42 + 48 + 75 = 270
∴ Central angle for Hindi = 60/270 × 360˚ = 80˚
Central angle for English = 45/270 × 360˚ = 60˚
Central angle for Maths = 42/270 × 360˚ = 45˚
Central angle for Hindi = 48/270 × 360˚ = 64˚
And Central angle Social study = 72/270 × 360˚ = 100˚

- Qstn #9Mr. Kapoor compares the prices (in Rs.) of different items at two different shops A and B. Examine the following table carefully and represent the data by a double bar graph.
 Ans :
Ans :
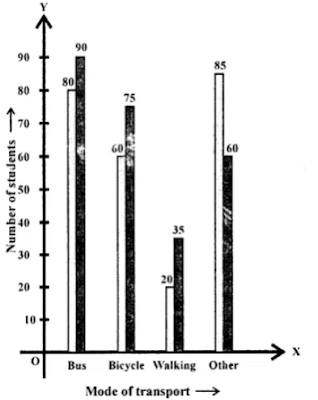
- Qstn #10The following tables shows the mode of transport used by boys and girls for going to the same school.
 Draw a double bar graph representing the above data.
Ans :